|
Welcome to a VIA Online Learning Tutorial: This site has been developed to provide learning materials to enable you to create X-ray exposure charts.
Select Chapter:
1. INTRODUCTION
2. STARTING
3. CREATING [print this page]
4. OPTIMISED

Creating YOUR technique chart
Congratulations.
You have successfully completed the required steps to arrive at meaningful exposure values for a known thickness of tissue. Now you must create exposure charts that predict appropriate exposure factors for the range of patient thicknesses that you expect to encounter. In this exercise you will extrapolate your trial exposures and establish predictable exposure factors when using a grid for patients measuring between 9 and 25cm thickness.
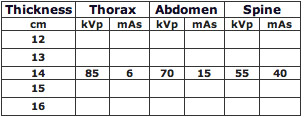
Table 4 : Successful test exposure factors
Extrapolate kVp values
The next step is to return to YOUR kVp-variable chart (Table 3) and extrapolate the remaining kVp values from your successful test exposures. The formula for kVp extrapolation is:
• From the row displaying the successful test exposures for the thorax, abdomen and spine, work down the kVp columns until you reach the row for thicknesses of 25cm, adding 2kVp for each centimetre increase in tissue depth for exposures less than 80kVp; 3kVp for each centimetre increase in tissue depth for exposures between 80kVp and 100kVp; and 4kVp for each centimetre increase in tissue depth for exposures greater than 100kVp.
• From the row displaying the successful test exposures for the thorax, abdomen and spine, work up each of the kVp columns until you reach the row for thicknesses of 9cm, subtracting 3kVp for each centimetre decrease in tissue depth for exposures between 80kVp and 100kVp and 2kVp for each centimetre decrease in tissue depth for exposures less than 80kVp.
To check your work so far, compare YOUR kVp-variable chart with table 5.
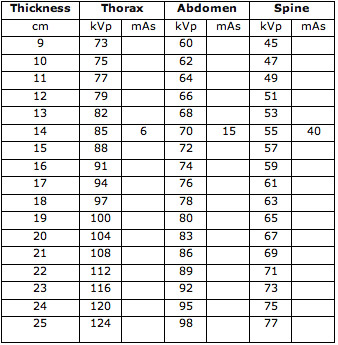
Table 5: Extrapolated technique chart
Fill in
To complete your kVp-variable chart, fill in the spaces with the constant mAs value determined for each body area but your test exposures.
A kVp-variable chart is the ideal radiographic ready reckoner for exposure factors because it allows the X-ray machine operator to adjust X-ray penetration in proportion to patient thickness.
By using a kVp-variable chart, you will be tailoring your exposures to your patients -- selecting photons that are more penetrating for thick tissues, and photons that are less penetrating for thinner subjects.
Modify
You could leave the technique chart as it is, but because the preferred range of thoracic tissue opacities is achieved using a high kVp range, you will want to modify some of your thoracic exposure settings. To do this, select the lowest thoracic exposures that is less than 80 kVp and add 10 kVp to it. Then, extrapolate the other kVp settings that were less than 80 by the extrapolation method that you used to create your chart in the first place. Compensate for overexposure by reducing the mAs setting by 50%
The final kVp-variable chart looks like this:
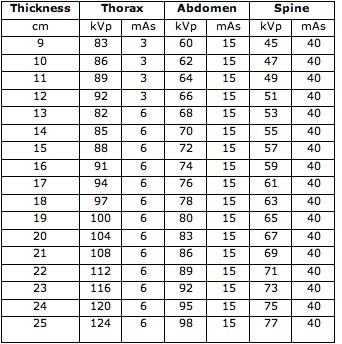
Table 6: Completed kVp variable technique chart
Problems of impractical exposure values
When viewing your completed chart you may decide that some extrapolated exposure factors do not fall within the available exposure range offered by your particular xray machine.
If some kVp values exceed your machines capacity you will need to compensate at some point on your chart by reducing the kVp setting and increasing the mAs value using rules already defined earlier in the program.
If some kVp values fall below the lowest available kVp setting then adjust the low kVp values upward while decreasing the mAs values to compensate for this change.
If some exposure times are excessively long and you are already using the highest available mA setting, there are some solutions that may help. Lower exposure times will be achieved by selecting a faster receptor speed, using a lower ratio grid and by reducing the anode-film distance. The ultimate solution to excessively long exposure times is to purchase a machine with more mA.
Modifying factors
Under certain circumstances the kVp will need to be increased or decreased from the value indicated by a standard kVp-variable chart. For example, increased opacity due to fluid will cause a radiograph at a standard exposure to be underexposed if the patient has ascites or pleural effusion. Table 7 presents a useful guide to common variations.
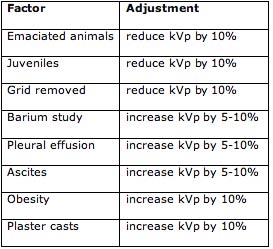
Table 7: Modifying factors for kVp variable charts
Test
Your kVp-variable chart needs to be tested on a variety of animals. Record the patient thickness and exposure factors for every radiograph you take. Always check the quality of your processed films and document under- or overexposures. Be prepared to modify your chart if consistent exposure problems become apparent after using it on several subjects.
Chart failure
If your kVp-variable chart is unreliable, perhaps the reason may be one of the factors listed in Table 8. If the problem persists after you have checked each of these possibilities, go back to your test animal and repeat the original exposures to determine whether your chart is based on appropriate test exposure factors.
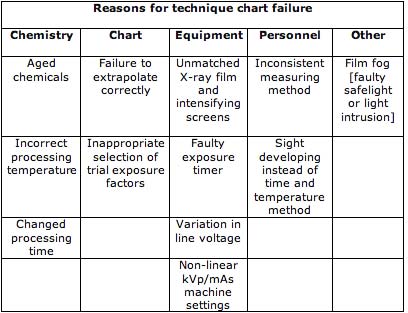
Table 8: Reasons for technique chart failure
Additional charts
Now that you have successfully completed your first chart, you are ready to make additional charts to cover the range of cases you see regularly, including:
• cats
• birds
• small exotic species
• small dogs that dont require a grid
• hips and elbows of large dogs for certification schemes based on radiographic assessment.
<< Previous chapter "Starting" Next chapter "Optimised" >>
|